ME606 Digital Signal Processing, Melbourne Institute Of Technology, Australia
Master of Engineering (Telecommunications) School of Information Technology and Engineering
z-Transforms, Filters Concepts
DO YOU WANT TO EXCEL IN ME606 DIGITAL SIGNAL PROCESSING ASSIGNMENT - ORDER AT EXPERTSMINDS!
Question 1: Designing a low pass FIR filter using Windowed Fourier Series approach.
Answer: 1. Impulse Response
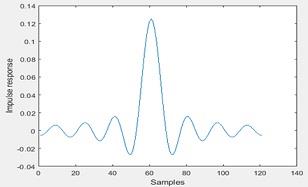
Figure 1 Impulse response of the low pass filter in rectangular window
Amplitude Spectrum
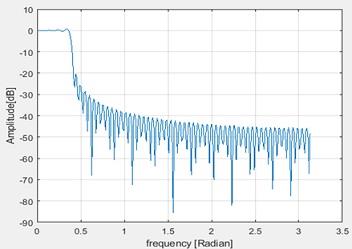
Figure 2 Frequency Spectrum
2. Filter frequency response at wp = pi/8 is shown below
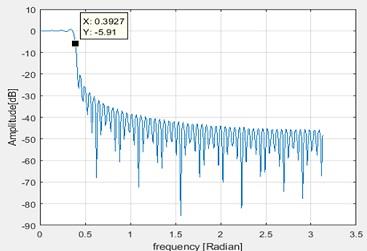
Figure 3 Filter frequency response at pi/8
This is measured as 5.91dB which is almost -6dB
Maximum ripple in the pass band is given below figure as 0.6821dB
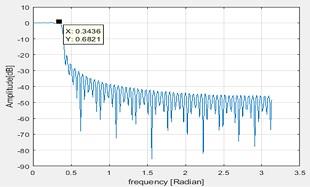
Figure 4 Maximum ripple in pass band
3. If the stopband starts at -20dB, the ratio of the transient band to the passband
Transient band = ws - wp
ws = -20dB dB
wp = -0.7093dB
Transient band = -20.7093dB
(Transient band)/(pass band) = (-20.7093)/(-0.7093) = 29.19dB
4. When m is 255 the impulse and amplitude response are below
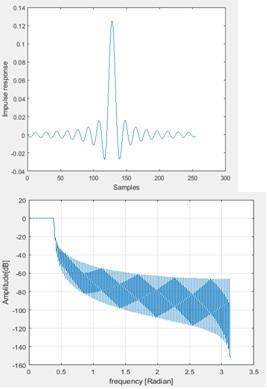
Figure 5 When the filter lenth is increased
a. If the stopband starts at -20dB, the ratio of the transient band to the passband
Transient band = ws - wp
ws = -20dB dB
wp = -0.5711dB
Transient band = -20.5711dB
(Transient band)/(pass band) = (-20.5711)/(-0.5711) = 36.02dB
b. Ripple in pass band is 0.7dB
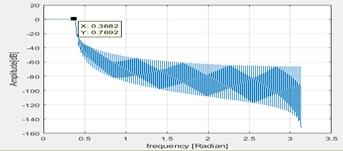
Figure 6 Maximum pass band
c. The effect of the filter length on the ripples and stopband attenuation: If the filter length is increased the ratio of the transition to the pass band is increased, whereas the stop band attenuation is -20dB itself.
5. Using the Hamming window the frequency response obtained is as below
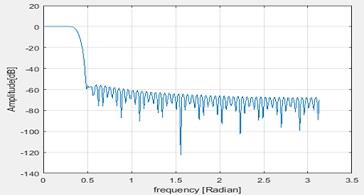
Figure 7 Hamming window
The stop band attenuation is -60dB. In the pass band the ripples are eliminated. This is the advantage of windowing.
Now if Hanning windowing is applied , the changes are as below
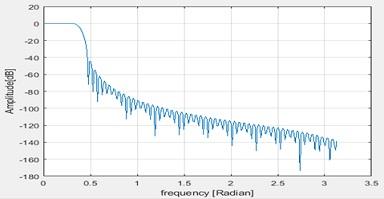
Figure 8 Hanning window
Here also the stop band attenuation is -60dB.
6. Now the pass band is changed to π/4
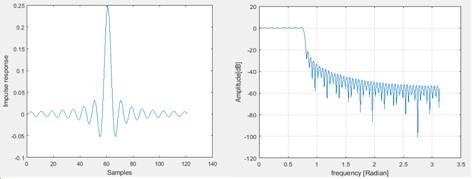
Figure 9 When the pass band is changed
The transition band is increased whereas the stop band remains same as -20dB itself and the pass band is changed with more ripples.
WORK TOGETHER WITH EXPERTSMIND'S TUTOR TO ACHIEVE SUCCESS IN ME606 DIGITAL SIGNAL PROCESSING ASSIGNMENT!
Question 2: Designing a bandpass FIR filter using Windowed Fourier Series approach
Answer: 1. The impulse response is as below
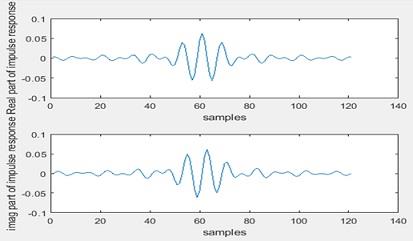
Figure 10 Response of the system
The amplitude spectrum is as below
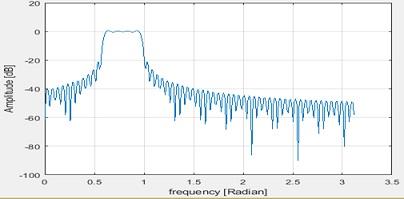
Figure 11 Frequency Spectrum
2. The pass band edges are given by
wp1 = -26.23dB , wp2 = -26.23dB and the frequency is almost 0.5 rad
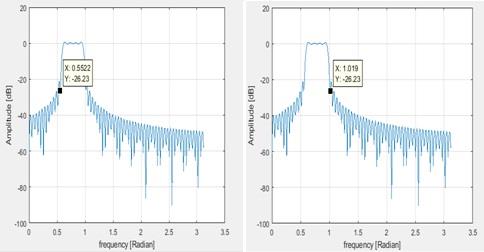
Figure 12 Pass band edges
The frequency at -6dB is as below
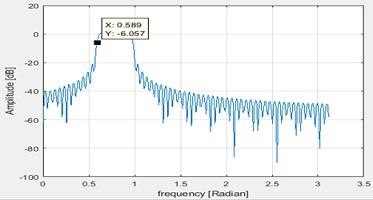
Figure 13 Frequency at -6dB
3. Maximum ripple in pass band is 0.7707dB
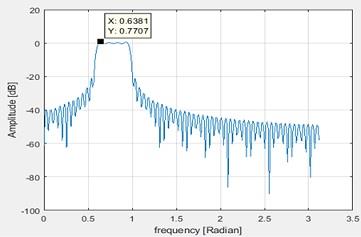
Figure 14 Maximum pass band
4. Now the pass band is changed to π/4
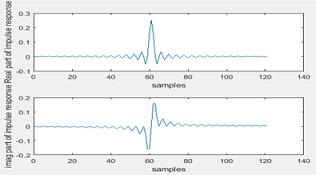
Figure 15 Impulse response
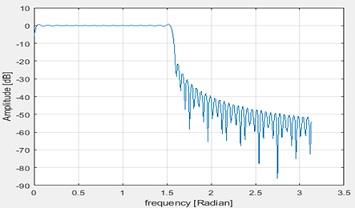
Figure 16 Fequency response
Wp1 = -2.788db and wp2 = -28.7dB
Here the pass band is more wider than the previous one which allows more frequencies to pass through.
ORDER NEW ME606 DIGITAL SIGNAL PROCESSING ASSIGNMENT AND GET 100% ORIGINAL SOLUTION AND QUALITY WRITTEN CONTENTS IN WELL FORMATS AND PROPER REFERENCING!
Question 3: Designing a band-stop FIR filter using Frequency sampling approach. In this section, you must write your own code to design a band stop filter using the knowledge you gained from the sections 1-1 and 1-2
Answer: 1. Mathlab code
wp = pi/8; % lowpass filter bandwidth
M = 121;
n = -(M-1)/2:(M-1)/2; % selection time window
h0 = (wp/pi)*sinc((wp/pi)*n); % truncated impulse response
h1 = h0.*rectwin(M)'; % windowing
h = h1.*exp(j*w0*n); % Lowpass to bandpass conversion
h2 = h1-h; % bandstop conversion
figure;
figure;plot(h2)
ylabel('Impulse response')
xlabel('Samples')
% spectrum
FFTsize = 512;
pxx = 20*log10(abs(fft(h2,FFTsize)));
fxx = (0:(FFTsize/2)-1)*(pi/(FFTsize/2));
figure;plot(fxx,pxx(1:FFTsize/2));ylabel('Amplitude [dB]');xlabel('frequency [Radian]');grid on
2. The frequency spectrum
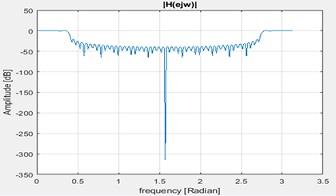
Figure 17 Frequency spectrum
3. Plot is as below
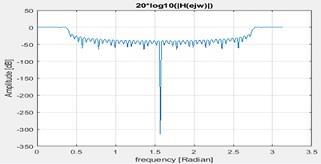
Figure 18 Spectrum
4. The amplitude at w=[w/4, 3w/4, w/2] are -37.14dB, -48.02dB and -42.26dB
5. The plot is as below
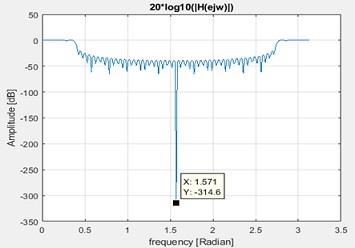
Figure 19 Spectrum when heading in included
MOST RELIABLE AND TRUSTWORTHY ME606 DIGITAL SIGNAL PROCESSING ASSIGNMENT HELP AND ASSESSMENT WRITING SERVICES AT YOUR DOORSTEPS!
Question 4: Designing a low pass FIR filter using Frequency sampling approach
Answer: 1. The responses are as below
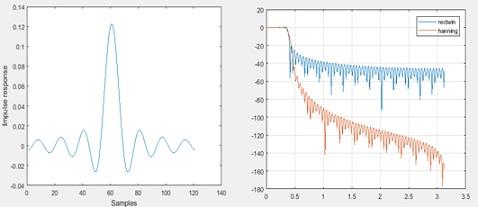
Figure 20 Both the spectrums
In the rectangular window the number of side lobes are higher. Hanning window minimizes the same.
2. The plot is
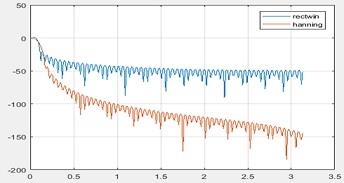
Figure 21 Spectrum
Section 2
3. Given that
H(Z) = ((1 - o.2Z-1)/((1 - o.5Z-1)(1 - o3Z-1)))
We need to find the ROC
Re arranging this we get
(Z(Z - 0.2))/((Z - 0.5)(Z - 0.3))
By partial fraction solving we get
1 + (0.175/(Z - 0.5)) - (0.075/(Z - 0.3))
Taking inverse Z transform we get
∂(n) + 0.175 (0.5)n - 0.075(0.3)n
ROC will be n>o
4. The system is unstable as the poles lie on the left half.
5. It is a general form of filter
We can represent y(n) = ∑_(k=0)^M (bk X(n-k)) - ∑_(k=0)^N (ak Y(n-k))
On taking Z transform (Y(Z))/(X(Z)) = (bo+b1Z-1+ ---±BMZ-M)/(a0+a1Z±--±aNZ-N)
6. The values can be found out if we know the a,b, M and N values
7. The plot is
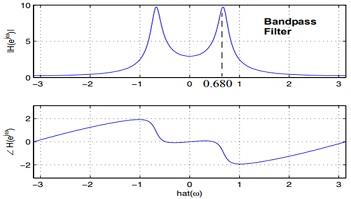
Figure 22 Various Figures
8. It is a band pass filter
9. The block diagram is
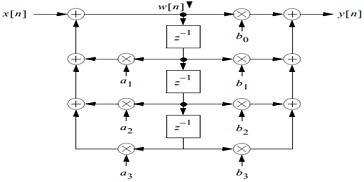
Figure 23 Block Diagam
10. y(n) = ∑_(k=0)^M (bk X(n-k)) - ∑_(k=0)^N (ak Y(n-k))
11. The plot is
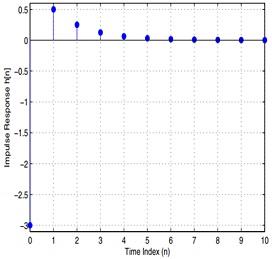
Figure 24 Impulse response
Section 3 Filtering
12. The plot os
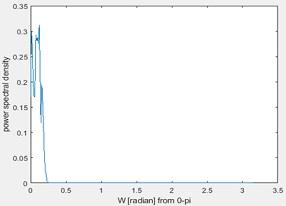
Figure 25 Power spectral density
It is the power spectral density estimate.
13. The plot is
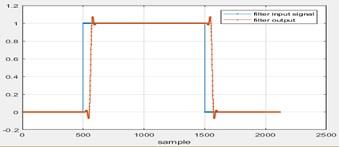
Figure 26 Filter characteristics
Delay by 0.099 compared to input.
Receive quality Melbourne Institute Of Technology, Australia assignment help and online tutor service for its major courses and units, like:
- ME503 - Telecommunication System Engineering Assignment Help
- ME700 - Industry Experience Assignment Help
- ME603 - Project Assignment Help
- ME601 - Telecommunication Modeling and simulation Assignment Help
- ME602 - Mobile and Satellite Communication Systems Assignment Help
- ME501 - Professional Engineering Practice Assignment Help
- MN605 - Enterprise Network Design Assignment Help
- ME693 - Software-Defined Radio Communication Assignment Help
- MN503 - Overview of Internetworking Assignment Help
- MN506 - System Management Assignment Help